
Research demonstrates that where you live can predict your lifespan, often more accurately than your genes. We are learning that diverse, non-medical economic, social, political and environmental factors—typically referred to as the social determinants of health—play a significant role in driving health and well-being.
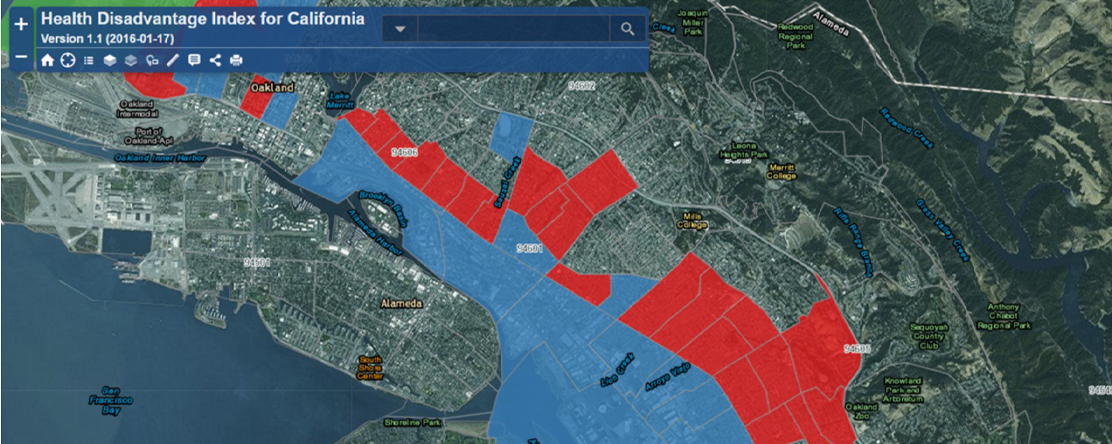
To provide a census-tract level snapshot of the social determinants of health across California and a mechanism to inform the design of interventions in underserved communities, PHI’s Public Health Alliance of Southern California, in collaboration with health departments across the state, developed the new California Health Disadvantage Index. It features a user-friendly interactive mapping tool with key factors to identify populations most vulnerable to poor health outcomes, along with measures to advance equity at a local level.
 “The Health Disadvantage Index provides a fine-grained illustration at a geographic level that makes sense to the decision makers that have the greatest ability to impact these social determinants: local elected officials, planners, engineers, investors, NGOs and others,” says Tracy Delaney, Ph.D., Executive Director of the Public Health Alliance of Southern California. “By connecting something like employment data to health, we can communicate that addressing root causes like unemployment and housing can ultimately improve health outcomes.”
The index also ranks census tracts statewide, and is a useful tool in prioritizing areas with high levels of social disadvantage. By quickly flagging key metrics, the goal is to help communities and policy makers target limited resources and guide effective on-the-ground actions.
Delaney and her team envision the Health Disadvantage Index helping users—particularly those who don’t work in public health—to think in a focused way about how their projects can be designed to yield the greatest health co-benefits. While public health practitioners have reached a broad consensus around the importance of upstream prevention and the role of social determinants, according to Delaney, these ideas are often still new to colleagues working in other sectors such as transportation or public education.
“There is a lot of opportunity for us to build health into other sectors’ projects,” explains Delaney. “The Health Disadvantage Index is a tool to help the public health community articulate the many cross-cutting actions that improve health, and to help enable other sectors to ‘move the needle’ within their individual disciplines toward achieving the broader goals of reducing chronic disease rates and improving public health.”
The data displayed in the Health Disadvantage Index are from a variety of publicly accessible sources, including the American Community Survey and the California Department of Public Health’s Healthy Community Indicator Project. What is novel about the index is how the data have been combined into “domains,” which have then been weighted to reflect a best guess of each domain’s proportional contribution to health.
The economic resources domain is heavily weighted, for instance, because evidence suggests economic resources can be leveraged for higher quality childcare, educational opportunities, more time to engage in healthy lifestyle behaviors, and for better quality living environments—all of which contribute to overall health.
 “At the same time, there is a lot we don’t know about how factors combine to determine population health,” says Delaney, “and because some important indicators are not available at a census-tract level statewide, the index is a work in progress.”
The Public Health Alliance of Southern California is in the process of enhancing the online mapping tool to allow users to combine census tracts so they can get composite scores for grant applications and projects spanning multiple tracts. They also plan to complete a validation study to determine how well the index is predicting life expectancy, and to possibly revise the weighting of composite domains to ensure that the index is tracking closely with documented health outcomes.
“Our ultimate goal is to really get at the root causes of health in this index, and to provide an opportunity for non-health partners to identify areas they can meaningfully impact for building healthy, equitable, vibrant and sustainable communities,” says Delaney.
Health Disadvantage Index materials are freely available online for use by communities and by public and private agencies. Click here to explore the index.


You change the world. We do the rest. Explore fiscal sponsorship at PHI.
Together, we can accelerate our response to public health’s most critical issues.
Begin your career at the Public Health Institute.

Communities across the U.S. and around the world are grappling with dangerous wildfires and extreme heat. Explore PHI's resources, tools, programs and impacts to help protect your community—with a focus on ways to reach systemically excluded groups with key resources and information, and invest in transformative solutions to promote safety, equity and resiliency.