Press Release
Another Soda Tax Success Story: Sugary Beverage Consumption Drops in San Francisco
-
Focus Areas
Chronic Disease Prevention, Healthy Communities -
Issues
Heart Disease -
Expertise
Evaluation, Public Policy Advocacy, Research – Survey -
Programs
Prevention Policy Group
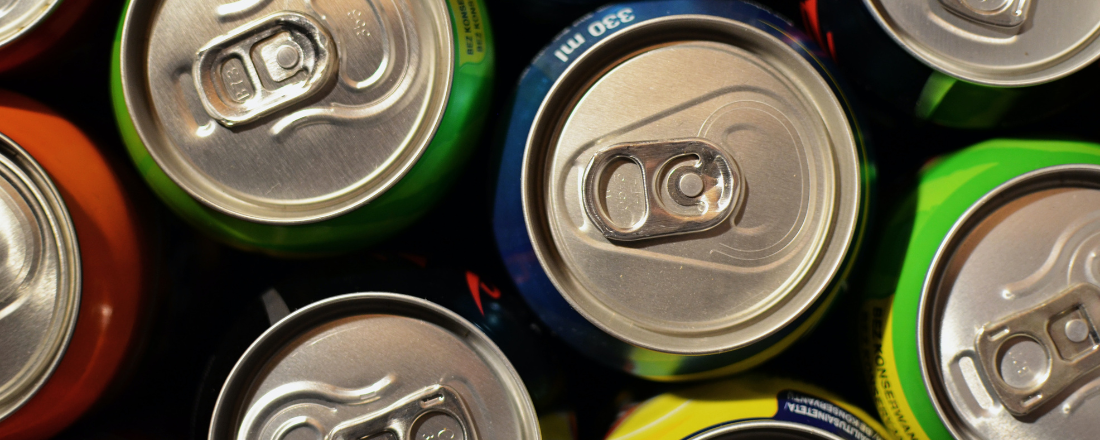
Oakland, CA — San Francisco’s sugar sweetened beverage (SSB) tax is working as intended, according to a new study published in PLOS Global Public Health by the Public Health Institute’s Prevention Policy Group. Consumption of SSBs declined markedly (34%) in San Francisco in the first two years after implementation of a soda tax on January 1st, 2018, in the areas studied.
SSB taxes have been gaining momentum worldwide as policies to address the negative health effects of sugary drinks by creating financial incentives to help consumers make healthier choices, promote healthier reformulation by industry, and raise revenue for building healthy communities.
The “SF Soda Tax” established a 1 cent per ounce fee on the initial distribution of drinks with added sugar, generating about $15-16 million each year. These new revenues fund a wide variety of health initiatives in San Francisco designed to address the root causes of systemic health inequities and the needs of disenfranchised communities, particularly low-income communities and communities of color.
Research findings
- PHI’s study found a 34.1% drop in consumption of sugary drinks in the San Francisco sample at two years post-tax, versus a 16.5% drop in San José, which did not institute a tax. The difference in change over time between the two cities was not statistically significant.
- In San Francisco, the probability of consuming greater than 6 ounces per day decreased by 4.3% in the first year and by 13.6% in the two years post-tax. In San José, this decrease was just 1% in the first year and less than 1% at two years post-tax.
- There was a significant difference in change over time (13.2%) in high consumption of SSBs between the two cities two years after the tax started.
- High SSB consumption decreased 23.6% among San Francisco respondents who were living below 200% of the federal poverty level, while increasing in San José, yielding another significant difference in change over time between the cities.
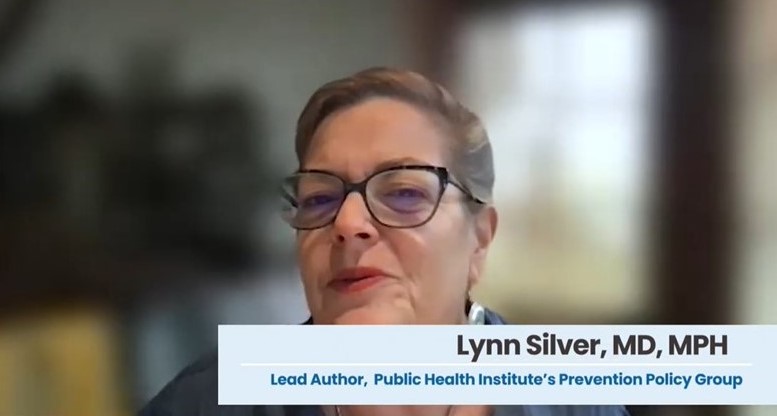
Note for media: Press can embed and edit the video footage with proper attribution to PHI, or contact us to access the original footage.
The study sampled different racial and ethnic groups from zip codes in San Jose and San Francisco, which had a higher density of Black and Latino residents and racial/ethnic groups with higher SSB consumption in California. This analysis paints a fuller and more robust picture of the positive health impact of soda tax policies and suggests that even a modest size tax can be effective in reducing high SSB consumption and mitigating the risk of harm.
“As in other US cities across the country, and countries around the world, San Francisco’s soda tax is working,” said Lynn Silver, MD, MPH, of the Public Health Institute (PHI), who led the National Institutes of Health funded study. “People are consuming less of these harmful sugary drinks which are fueling epidemics of obesity, diabetes, and fatty liver disease, leaving people more vulnerable to COVID, and which are linked to a host of other debilitating health problems. San Francisco’s policy is a win-win that improves public health and raises revenue to invest in health equity.”
This latest analysis comes on the heels of a growing body of literature demonstrating the positive impact of sugar sweetened beverage tax policies, from early adopters in the U.S., like Berkeley, Philadelphia, and Seattle, to other countries, including Mexico, Chile, South Africa, the United Kingdom, and Saudi Arabia. In most cases, soda taxes led to corresponding and significant declines in sales and/or consumption of sugar sweetened beverages. Taxes on SSBs have now been adopted in over 45 countries.
“The soda tax is working here in San Francisco—especially for communities most impacted by chronic disease. Not only are San Franciscans drinking fewer sugary beverages, the city has raised more than $50 million in soda tax revenues since 2018, and it is going right back into community programs to reduce sugary drink consumption, increase access to water and promote active living. San Francisco’s commitment to respecting the community-driven recommendations of its’ Tax Advisory Committee has ensured the soda tax keeps working for all of us.”
– Abby Cabrera, co-chair of the San Francisco Sugary Drinks Distributor Tax Advisory Committee.
The obesity epidemic has not gone away and overweight/obesity have proven to be major risk factors for hospitalization and death from COVID. New data from the Trust for America’s Health indicates obesity rates continue to climb nationwide, with 19 states having adult obesity rates at 35 percent or higher in 2022, up from 16 states the year before and vastly increased from just a few decades ago. Soda and other sugary drinks are the number-one source of added sugar in the American diet, and have been linked to diabetes, cancer, obesity, heart and liver disease, tooth decay and other illnesses.
While research over the years has shown that African American and Latinx communities have some of the highest rates of SSB consumption, these same communities are also disproportionately targeted by the overwhelming marketing of sugary drinks and may struggle with other factors such as the lack of potable water or sodas that are priced lower than healthier drinks.
The corresponding financial burden on our healthcare system, employers and families, as well as the human cost of preventable amputations, blindness and kidney failure, is overwhelming and unacceptable. A 2014 CDC study found 40% of U.S. adults are expected to develop diabetes during their lifetime and more than half of Hispanic men and women as well as Black women are predicted to develop the disease.
“This new data demonstrates that San Francisco was successful in simultaneously improving public health while raising revenue for critical programs that build healthy communities and address the root causes of systemic inequities,” said Dr. Alisa Padon, a report co-author and research scientist at PHI. “We hope this research emboldens cities across the country to stand up to Big Soda.”
Over the past decade, the beverage industry has been taking pages out of Big Tobacco’s playbook. California, for instance, after passage of four Bay Area sugary drink taxes, was strong-armed by the American Beverage Association into preemptively banning all future local soda tax measures following an industry threat to push a statewide ballot measure requiring a 2/3’s threshold to pass local taxes. In another nod to Big Tobacco, Big Soda spent $10’s of millions in ad buys, lobbying, and deceptive public relations campaigns to prevent government and community efforts to institute soda taxes designed to put health and safety before corporate profit.
“San Francisco is just the latest face of a much broader community-led movement to put health and safety first, by pushing back against food industry interests that sacrifice wellbeing for profit,” concluded Dr. Silver. “Globally, a powerful coalition of community members, health systems, activists, and researchers are coming together to demand a food supply that nourishes rather than sickens. Fiscal policies like San Francisco’s that can protect health and raise revenue are a key part of that effort.”
Read the full studyMore Updates
Work With Us
You change the world. We do the rest. Explore fiscal sponsorship at PHI.
Support Us
Together, we can accelerate our response to public health’s most critical issues.
Find Employment
Begin your career at the Public Health Institute.
